Chapter 2. Defining Nonfunctional Requirements
The Internet was done so well that most people think of it as a natural resource like the Pacific Ocean, rather than something that was man-made. When was the last time a technology with a scale like that was so error-free?
Alan Kay, in interview with Dr. Dobb’s Journal (2012)
If you are building an application, you will be driven by a list of requirements. At the top of your list is most likely the functionality that the application must offer: what screens and what buttons you need, and what each operation is supposed to do in order to fulfill the purpose of your software. These are your functional requirements.
In addition, you probably have nonfunctional requirements: for example, the app should be fast, reliable, secure, legally compliant, and easy to maintain. These requirements might not be explicitly written down, because they may seem somewhat obvious, but they are just as important as the app’s functionality; an app that is unbearably slow or unreliable might as well not exist.
Many nonfunctional requirements, such as security, fall outside the scope of this book. But we will consider a few, and this chapter will help you articulate them for your own systems. In particular, we will look at the following:
-
Defining and measuring the performance of a system
-
What it means for a service to be reliable—namely, continuing to work correctly, even when things go wrong
-
Allowing a system to be scalable by having efficient ways of adding computing capacity as the load on the system grows
-
Making it easier to maintain a system in the long term
The terminology introduced in this chapter will also be useful in the following chapters, when we go into the details of how data-intensive systems are implemented. However, abstract definitions can be quite dry; to make the ideas more concrete, we will start this chapter with a case study of a social networking service, which will provide practical examples of performance and scalability.
Case Study: Social Network Home Timelines
Imagine we have been given the task of implementing a social network in the style of X (formerly Twitter), where users can post messages and follow other users. This will be a huge simplification of how such a service actually works [1, 2, 3], but it will help illustrate some of the issues that arise in large-scale systems.
Let’s assume that users make a total of 500 million posts per day, or 5,800 posts per second on average. Occasionally, the rate can spike to as high as 150,000 posts per second [4]. Let’s also assume that the average user follows 200 people and has 200 followers (although there is a very wide range: most people have only a handful of followers, and a few celebrities, such as Barack Obama, have over 100 million followers).
Representing Users, Posts, and Follows
We keep all the data in a relational database, as shown in Figure 2-1. We have one table for users, one table for posts, and one table for follow relationships.
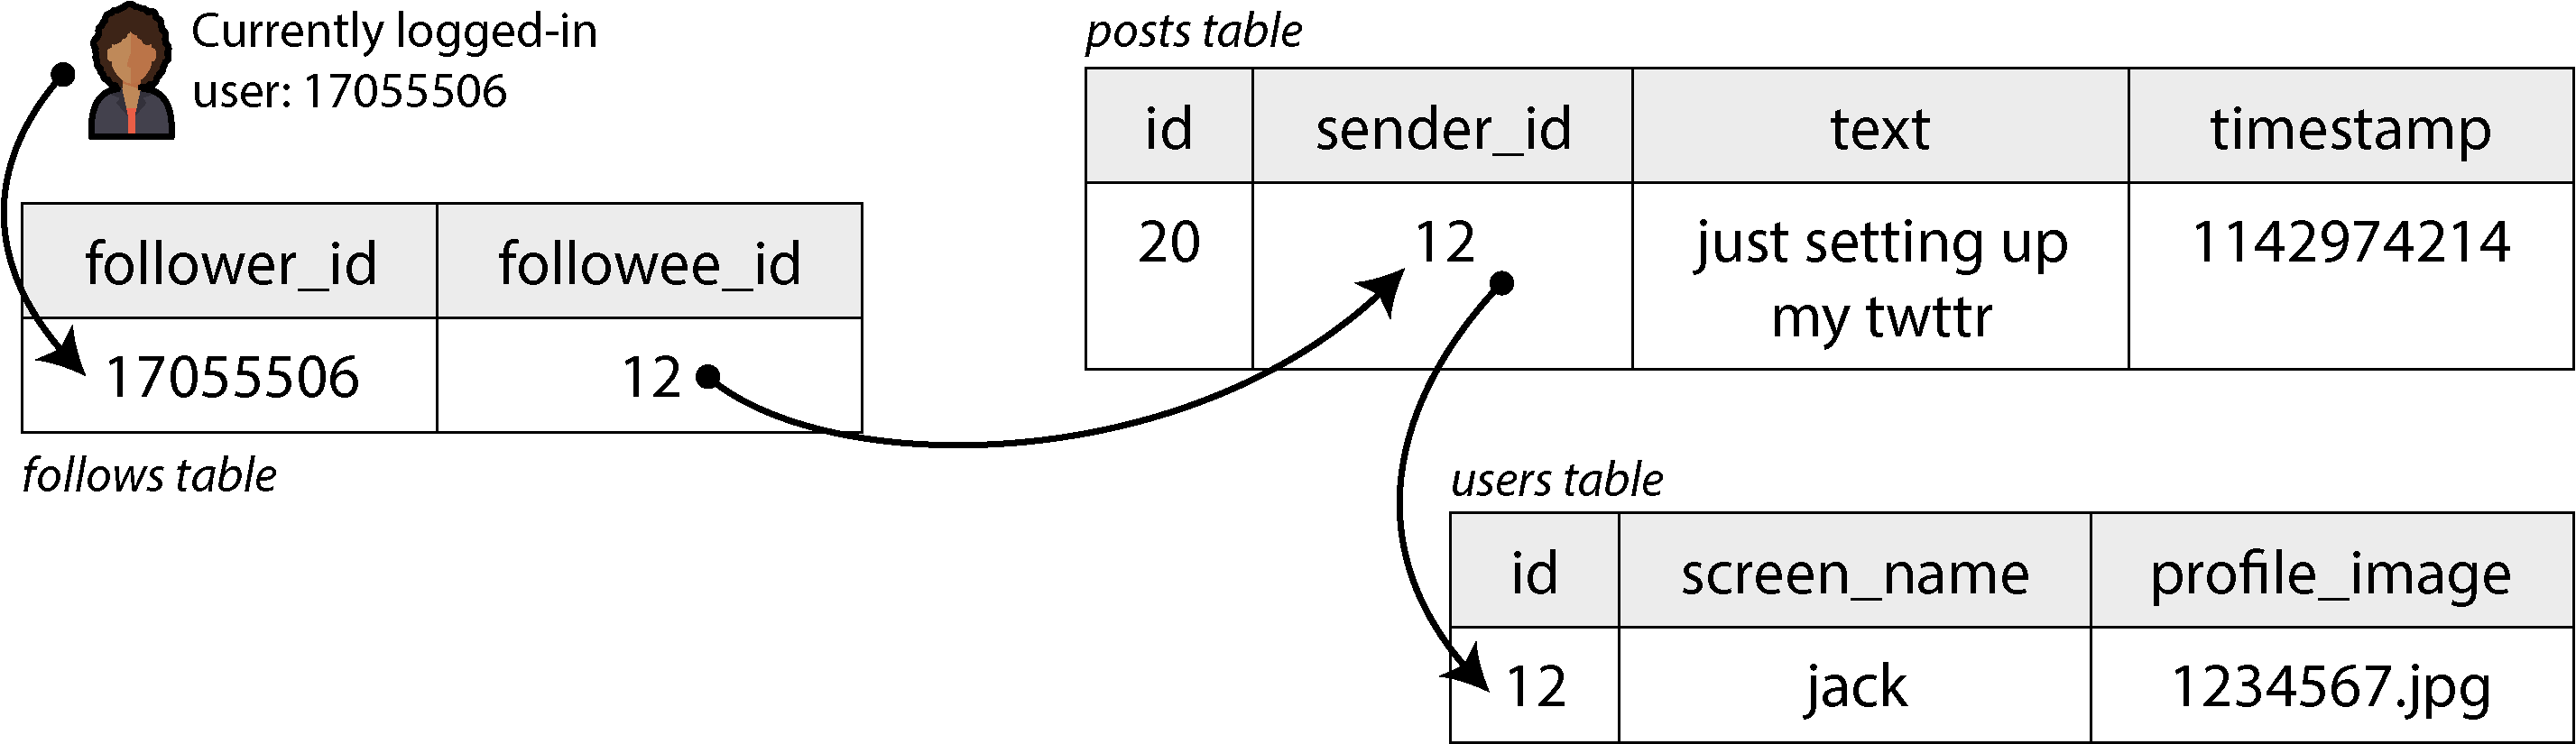
Figure 2-1. A simple relational schema for a social network in which users can follow one another
Let’s say the main read operation that our social network must support is the home timeline, which displays recent posts by people the user is following (for simplicity we will ignore ads, suggested posts from people they are not following, and other extensions). We could write the following SQL query to get the home timeline for a particular user:
SELECTposts.*,users.*FROMpostsJOINfollowsONposts.sender_id=follows.followee_idJOINusersONposts.sender_id=users.idWHEREfollows.follower_id=current_userORDERBYposts.timestampDESCLIMIT1000
To execute this query, the database will use the follows table to find everybody who
current_user is following, look up recent posts by those users, and sort them by timestamp to get
the most recent 1,000 posts by any of the followed users.
Posts are supposed to be timely, so let’s assume that after somebody makes a post, we want their followers to be able to see it within five seconds. One approach is for the user’s client to repeat the preceding query every five seconds while the user is online (this is known as polling). If we assume that 10 million users are online and logged in at the same time, that would mean running the query 2 million times per second. Even if we were to poll less frequently, this is a lot.
This query is also quite expensive: if a user is following 200 people, the query needs to fetch a list of recent posts by each of those 200 people and merge those lists. Two million timeline queries per second times 200 followed accounts makes 400 million lookups per second—a huge number. And that’s the average case. Some users follow tens of thousands of accounts; for them, this query is very expensive to execute and difficult to make fast.
Materializing and Updating Timelines
How can we do better? First, instead of polling, it would be better if the server actively pushed new posts to any followers who are currently online. Second, we should precompute the results of the query so that a user’s request for their home timeline can be served from a cache.
Imagine that for each user, we store a data structure containing their home timeline (i.e., the recent posts by people they are following). Every time a user makes a post, we look up all their followers and insert that post into the home timeline of each follower—like delivering a message to a mailbox. Now when a user logs in, we can simply give them this precomputed home timeline. Moreover, to receive a notification about any new posts on their timeline, the user’s client simply needs to subscribe to the stream of posts being added to their home timeline.
The downside of this approach is that we now need to do more work every time a user makes a post, because the home timelines are derived data that needs to be updated. The process is illustrated in Figure 2-2. When one initial request results in several downstream requests being carried out, we use the term fan-out to describe the factor by which the number of requests increases.
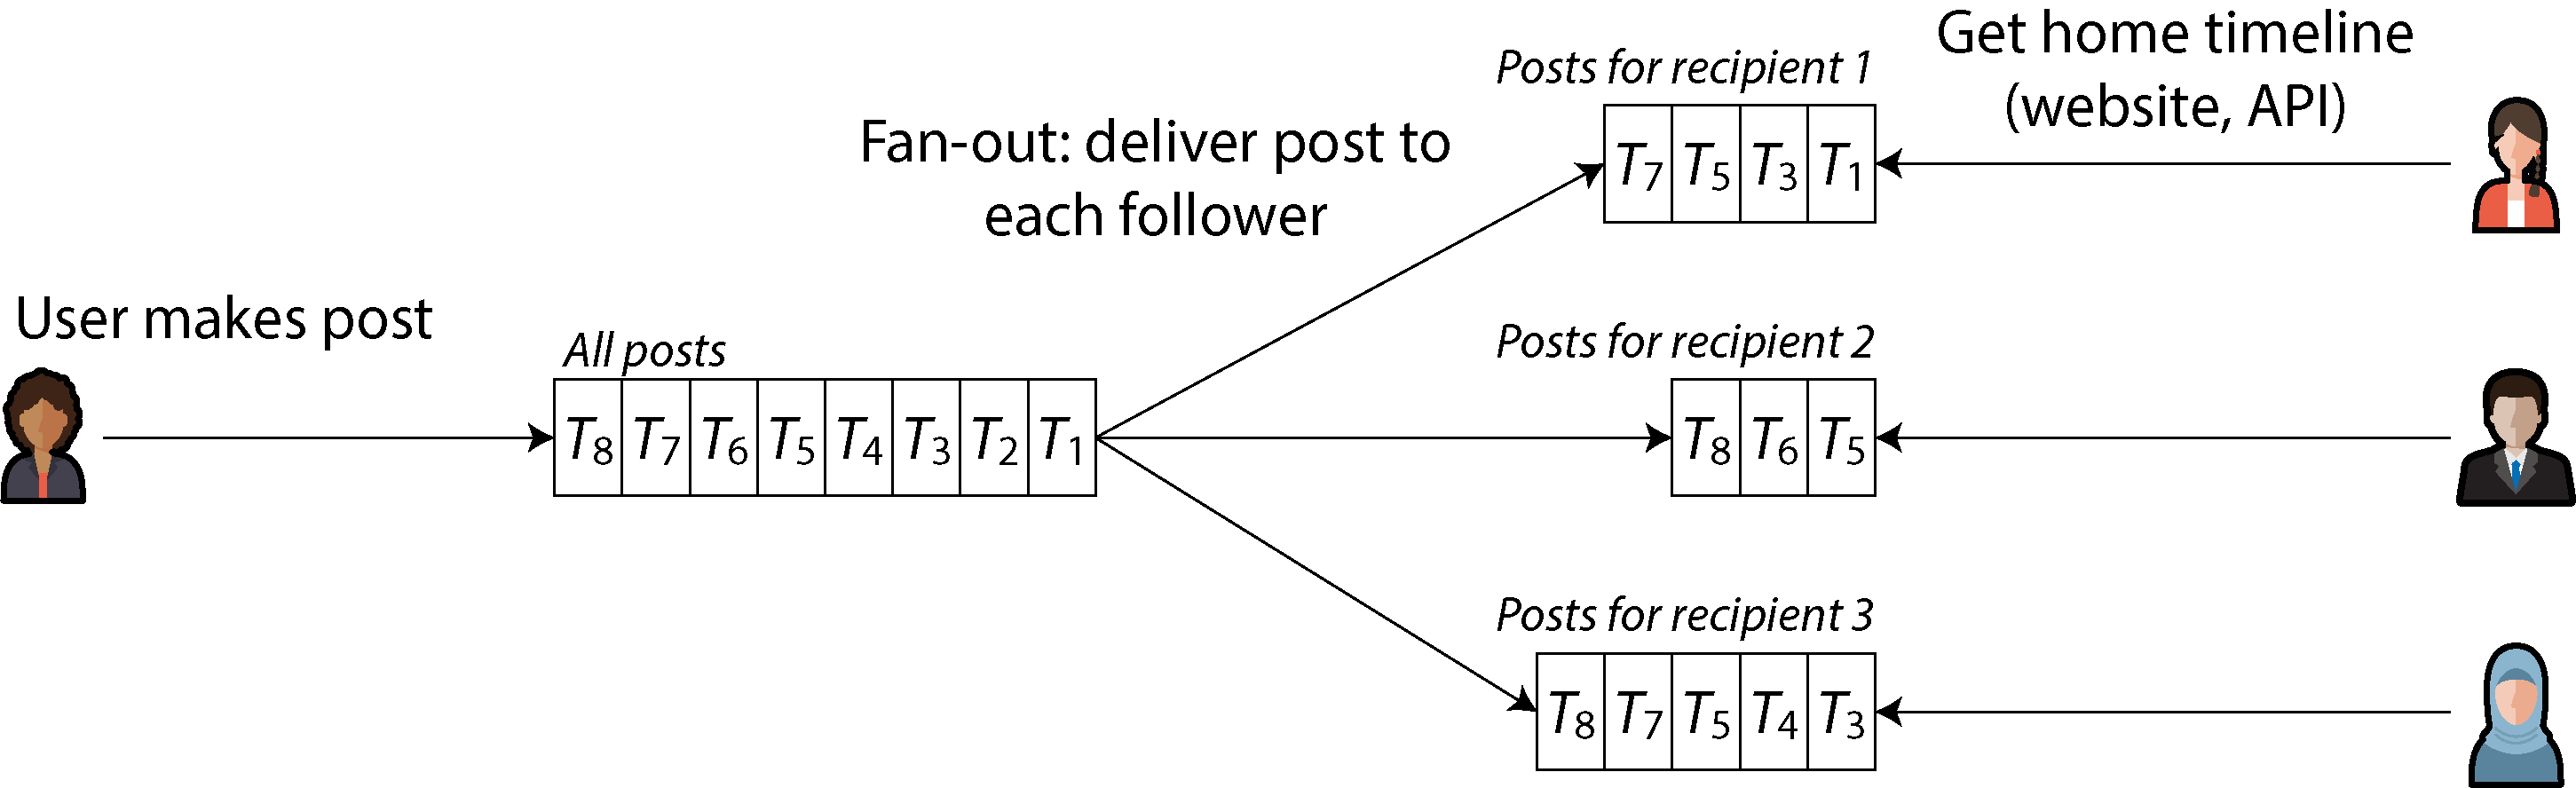
Figure 2-2. Fan-out: delivering new posts to every follower of the user who made the post
At a rate of 5,800 posts per second, if the average post reaches 200 followers (i.e., a fan-out factor of 200), we will need to do just over 1 million home timeline writes per second. This is a lot, but it’s still a significant saving compared to the 400 million per-sender post lookups per second that we would otherwise have to do.
If the rate of posts spikes because of a special event, we don’t have to do the timeline deliveries immediately—we can enqueue them and accept that it will temporarily take a bit longer for posts to show up in followers’ timelines. Even during such load spikes, timelines remain fast to load, since we simply serve them from a cache.
This process of precomputing and updating the results of a query is called materialization, and the timeline cache is an example of a materialized view (a concept we will discuss further in later chapters). The materialized view speeds up reads, but in return we have to do more work on writes. The cost of writes for most users is modest, but a social network also has to consider some extreme cases:
-
If a user is following a very large number of accounts, and those accounts post a lot, that user will have a high rate of writes to their materialized timeline. However, that user is not likely reading all the posts in their timeline, so it’s OK to simply drop some of their timeline writes and show the user only a sample of the posts from the accounts they’re following [5].
-
When a celebrity account with a very large number of followers makes a post, we have to do a lot of work to insert that post into the home timelines of each of their millions of followers. In this case, dropping some of those writes is not OK. One way of solving this problem is to handle celebrity posts separately from everyone else’s posts: we can save ourselves the effort of adding celebrity posts to millions of timelines by storing them separately and merging them with the materialized timeline when it is read. Despite such optimizations, handling celebrities on a social network can require a lot of infrastructure [6].
Describing Performance
Most discussions of software performance consider two main types of metric:
- Response time
-
The elapsed time from the moment when a user makes a request until they receive the requested answer. The unit of measurement is seconds (or milliseconds, or microseconds).
- Throughput
-
The number of requests per second, or the data volume per second, that the system is processing. For a given allocation of hardware resources, there is a maximum throughput that can be handled. The unit of measurement is “somethings per second.”
In the social network case study, “posts per second” and “timeline writes per second” are throughput metrics, whereas “time it takes to load the home timeline” and “time until a post is delivered to followers” are response time metrics.
Throughput and response time are often related. An example of such a relationship for an online service is sketched in Figure 2-3. The service has a low response time when request throughput is low, but response time increases as load increases. This is because of queueing: when a request arrives on a highly loaded system, the CPU is likely already in the process of handling an earlier request, and therefore the incoming request needs to wait until the earlier request has been completed. As throughput approaches the maximum that the hardware can handle, queueing delays increase sharply.
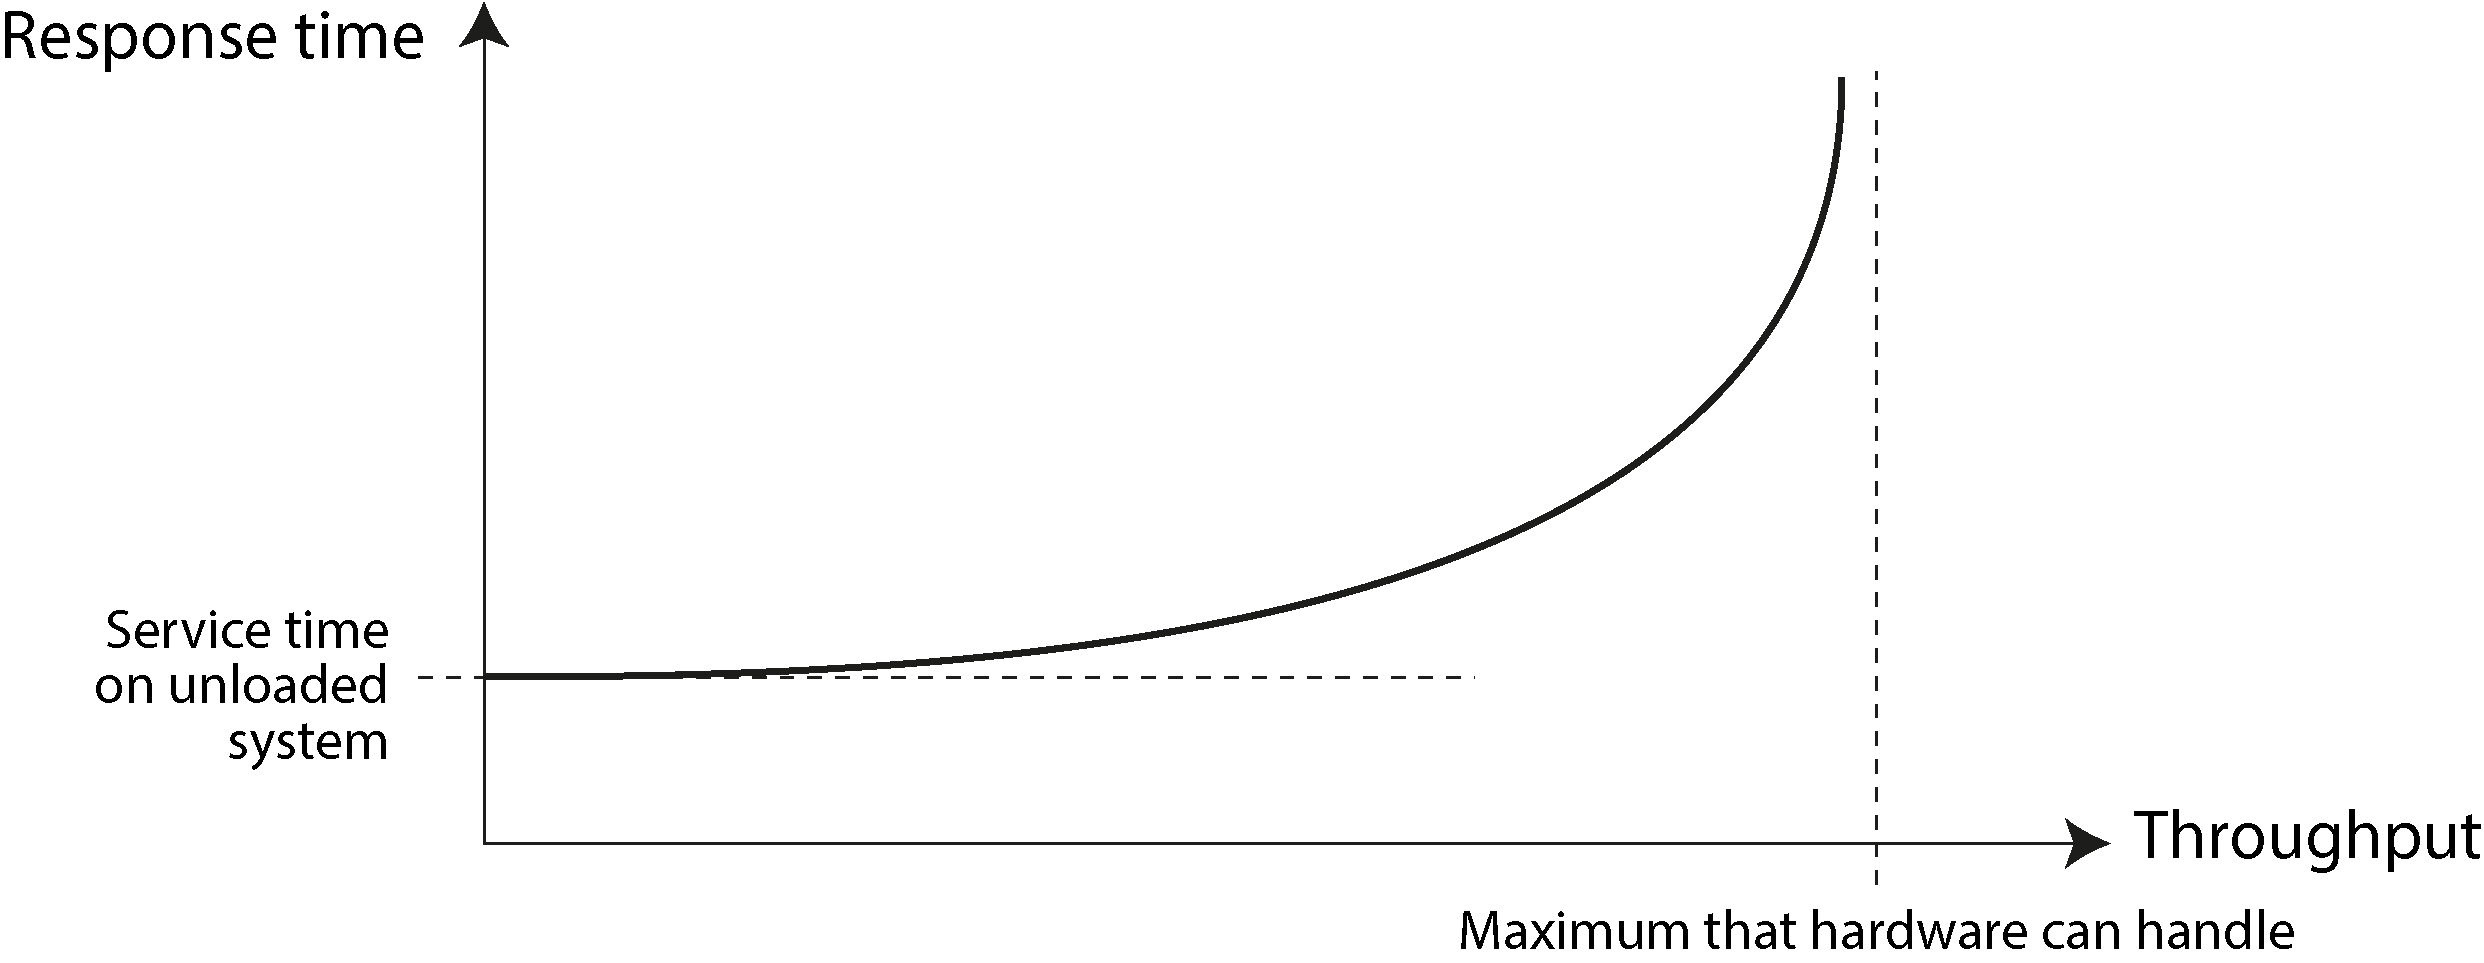
Figure 2-3. As the throughput of a service approaches its capacity, the response time increases dramatically because of queueing.
In terms of performance metrics, the response time is usually what users care about the most, whereas the throughput determines the required computing resources (e.g., how many servers you need) and hence the cost of serving a particular workload. If throughput is likely to increase beyond the current hardware’s capability, the capacity needs to be expanded; a system is said to be scalable if its maximum throughput can be significantly increased by adding computing resources.
In this section we will focus primarily on response times, and we will return to throughput and scalability in “Scalability”.
Latency and Response Time
“Latency” and “response time” are sometimes used interchangeably, but in this book we will use these and a few related terms in a specific way (illustrated in Figure 2-4):
-
The response time is what the client sees; it includes all delays incurred anywhere in the system.
-
The service time is the duration for which the service is actively processing the client’s request.
-
Queueing delays can occur at several points in the flow—for example, after a request is received, it might need to wait until a CPU is available before it can be processed, or a response packet might need to be buffered before it is sent over the network if other tasks on the same machine are sending a lot of data via the outbound network interface.
-
Latency is a catchall term for time during which a request is not being actively processed—that is, during which it is latent. In particular, network latency or network delay refers to the time that a request and response spend traveling through the network.
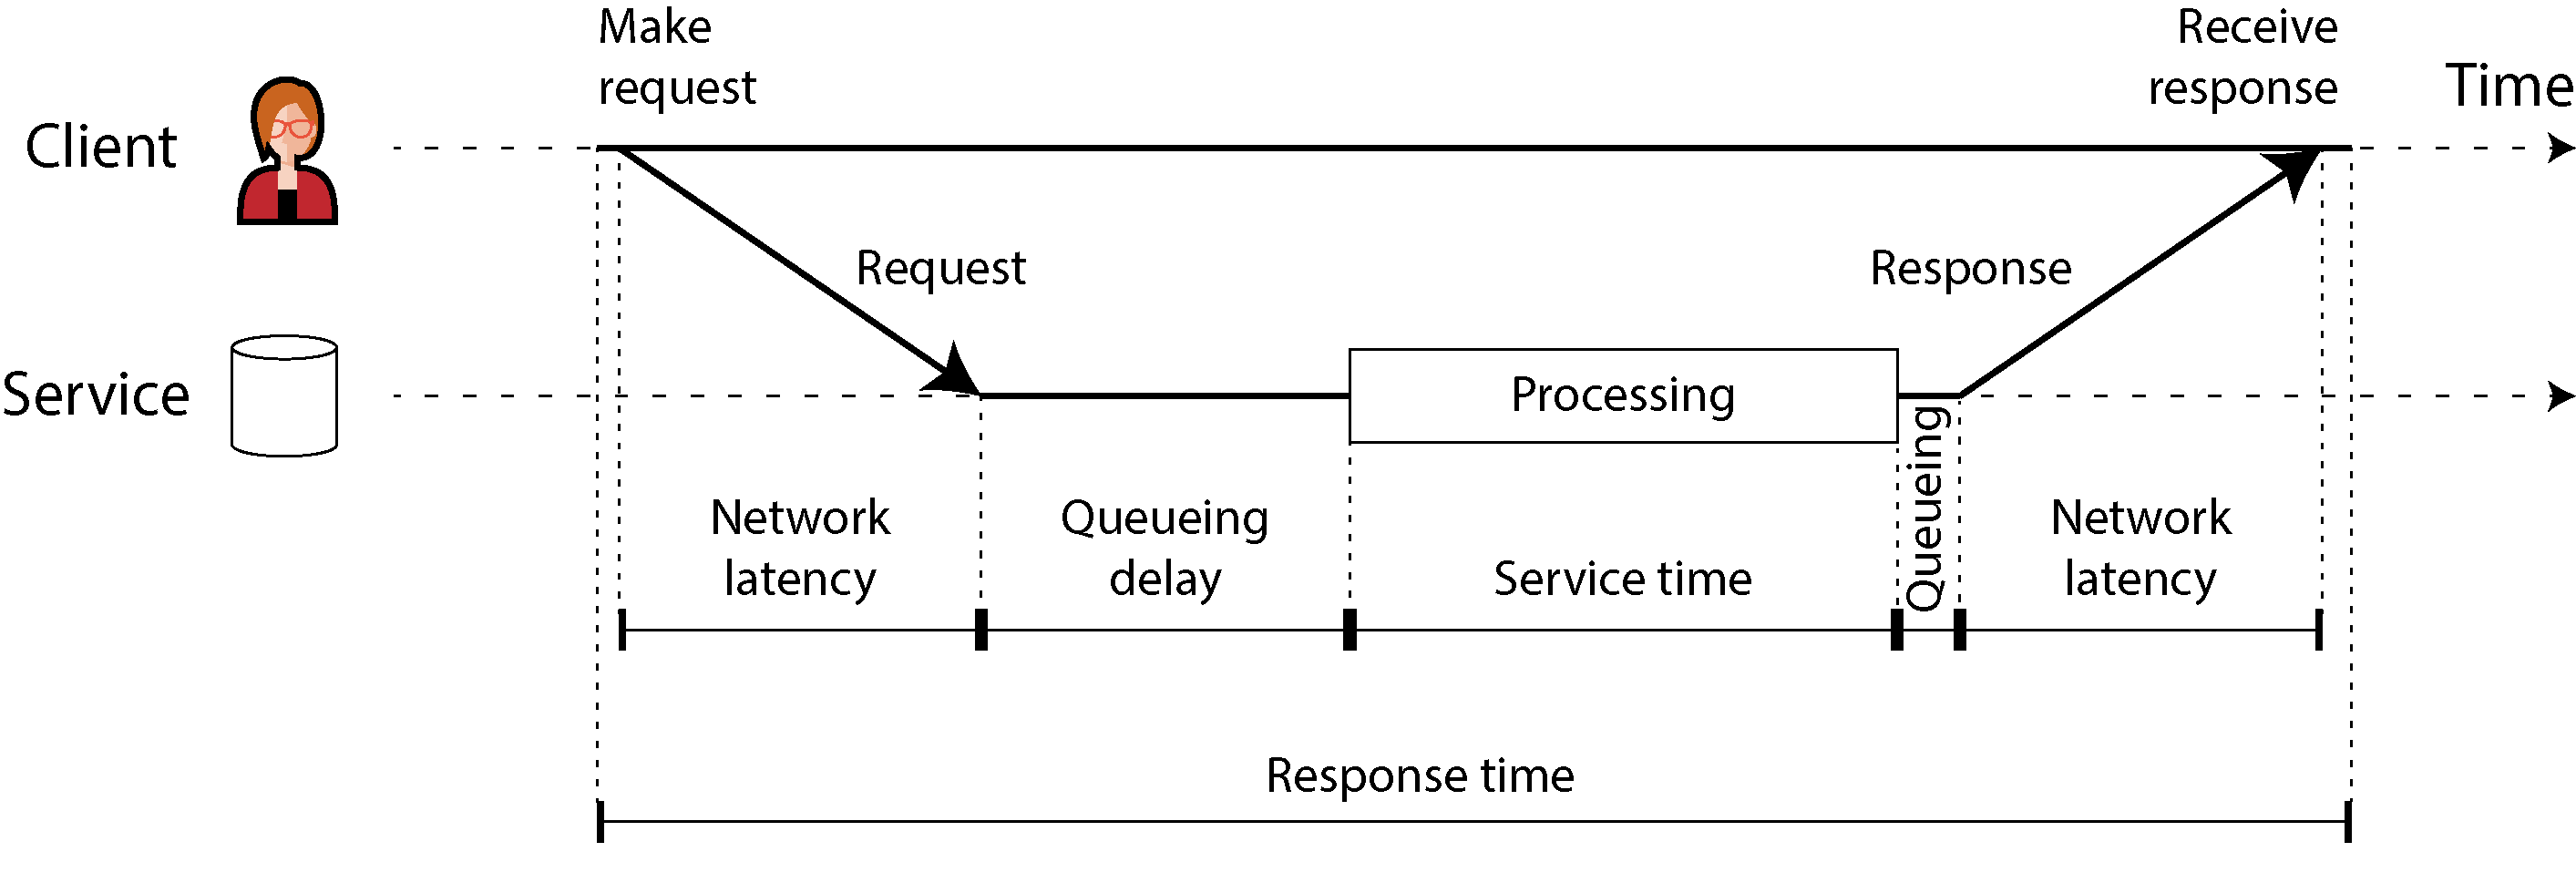
Figure 2-4. Response time, service time, network latency, and queueing delay
In Figure 2-4, time flows from left to right; each communicating node is shown as a horizontal line, and a request or response message is shown as a thick diagonal arrow from one node to another. You will encounter this style of diagram frequently over the course of this book.
The response time can vary significantly from one request to the next, even if you keep making the same request over and over again. Many factors can add random delays—for example, a context switch to a background process, the loss of a network packet and TCP retransmission, a garbage collection pause, a page fault forcing a read from disk, or mechanical vibrations in the server rack [18]. We will discuss this topic in more detail in “Timeouts and Unbounded Delays”.
Queueing delays often account for a large part of the variability in response times. As a server can process only a small number of things in parallel (limited, for example, by its number of CPU cores), it takes only a small number of slow requests to hold up the processing of subsequent requests—an effect known as head-of-line blocking. Even if those subsequent requests have fast service times, the client will see a slow overall response time due to the time waiting for the prior request to complete. The queueing delay is not part of the service time, and for this reason it is important to measure response times on the client side.
Average, Median, and Percentiles
Because the response time varies from one request to the next, we need to think of it not as a single number, but as a distribution of values that we can measure. In Figure 2-5, each gray bar represents a request to a service, and its height shows how long that request took. Most requests are reasonably fast, but occasional outliers take much longer. Variation in network delay is also known as jitter.
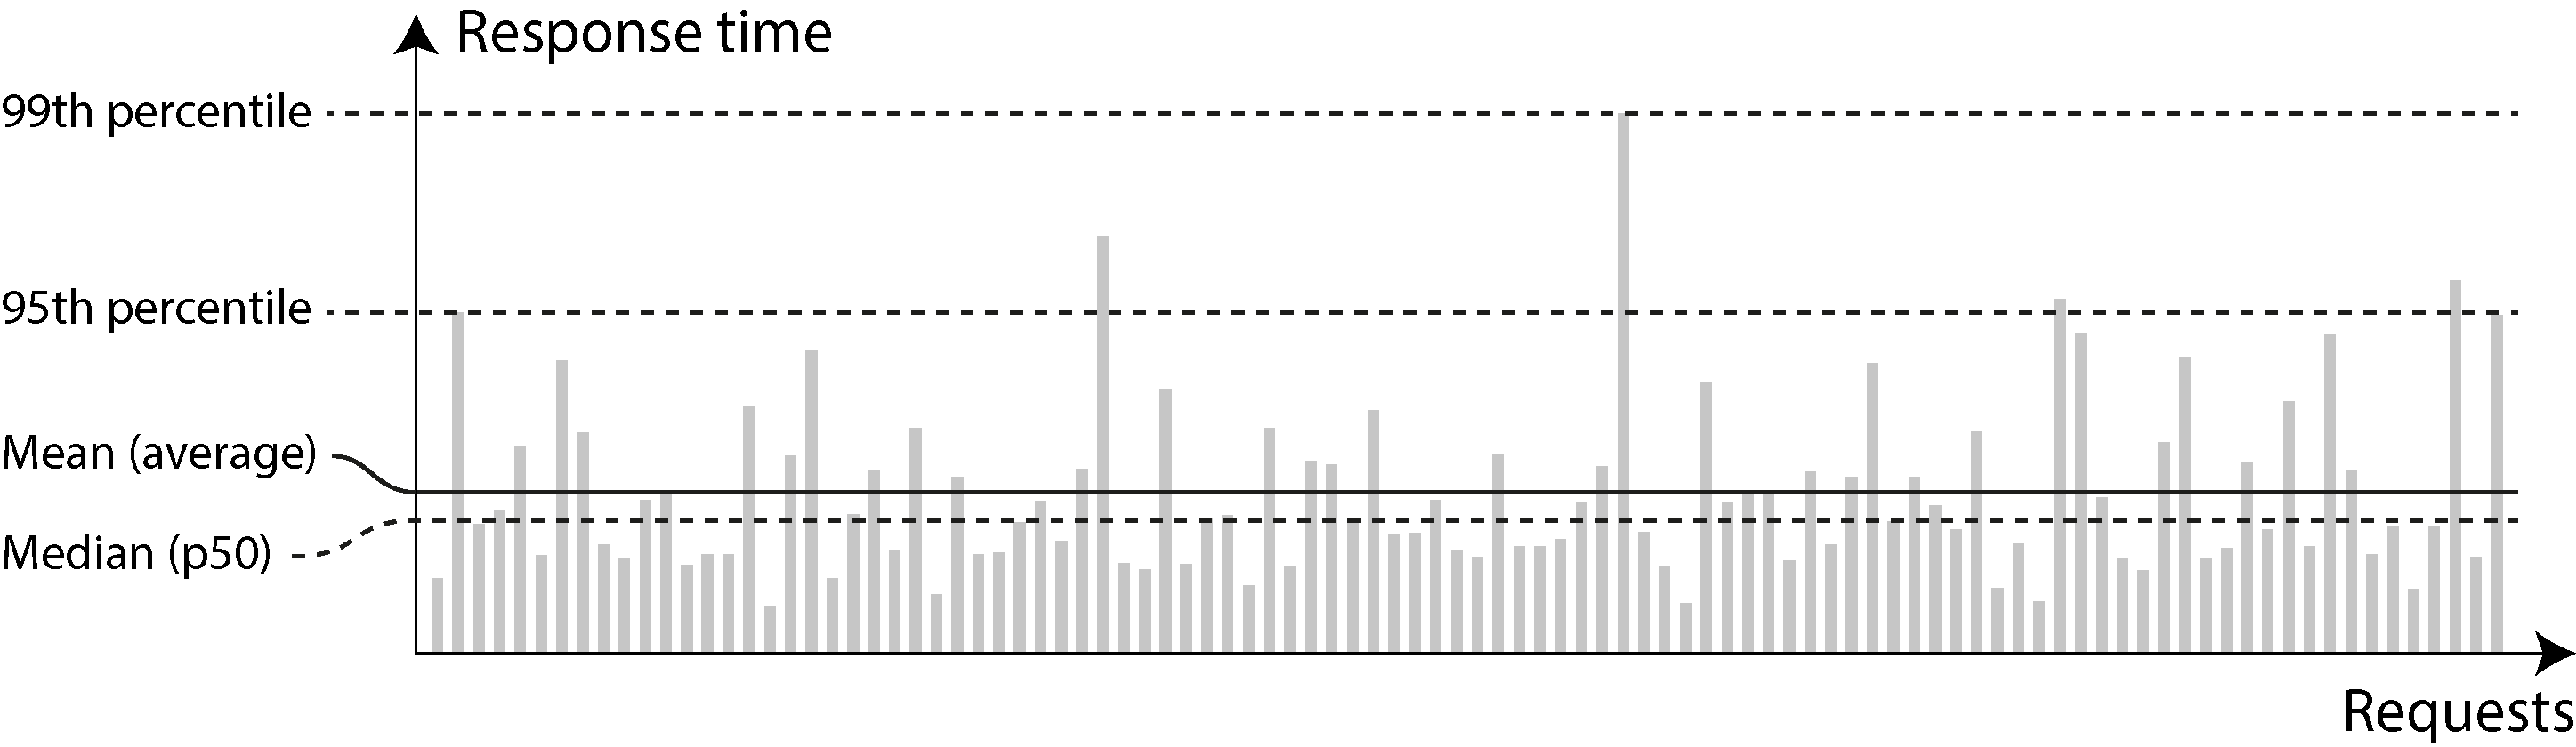
Figure 2-5. Illustrating mean and percentiles: response times for a sample of 100 requests to a service
It’s common to report the average response time of a service (technically, the arithmetic mean, which you find by summing all the response times and dividing by the number of requests). The mean response time is useful for estimating throughput limits [19]. However, the mean is not a very good metric if you want to know your “typical” response time, because it doesn’t tell you how many users actually experienced that delay.
Usually it’s better to use percentiles. If you take your list of response times and sort it from fastest to slowest, the median is the halfway point—for example, if your median response time is 200 ms, that means half your requests return in less than 200 milliseconds (ms), and half your requests take longer. This makes the median a good metric if you want to know how long users typically have to wait. The median is also known as the 50th percentile, sometimes abbreviated as p50.
To figure out how bad your outliers are, you can look at higher percentiles: the 95th, 99th, and 99.9th percentiles are common (abbreviated p95, p99, and p999). For example, if the 95th percentile response time is 1.5 seconds, that means 95 out of 100 requests take less than 1.5 seconds, and 5 out of 100 requests take 1.5 seconds or more. This is illustrated in Figure 2-5.
High response-time percentiles, also known as tail latencies, are important because they directly affect users’ experience of the service. For example, Amazon describes response time requirements for internal services in terms of the 99.9th percentile, even though this affects only 1 in 1,000 requests. This is because the customers with the slowest requests are often those who have the most data on their accounts, as they have made many purchases—that is, they’re the most valuable customers [20]. It’s important to keep those customers happy by ensuring the website is fast for them.
Optimizing the 99.99th percentile (the slowest 1 in 10,000 requests) was deemed too expensive and found to not yield enough benefit for Amazon’s purposes. Reducing response times at very high percentiles is difficult because they are easily affected by random events outside of your control, and the benefits are diminishing.
Use of Response Time Metrics
High percentiles are especially important in backend services that are called multiple times as part of serving a single end-user request. Even if you make the calls in parallel, the request still needs to wait for the slowest of the parallel calls to complete. It takes just one slow call to make the entire end-user request slow, as illustrated in Figure 2-6. Even if only a small percentage of backend calls are slow, the chance of getting a slow call increases if an end-user request requires multiple backend calls, so a higher proportion of such end-user requests end up being slow (an effect known as tail latency amplification [27]).
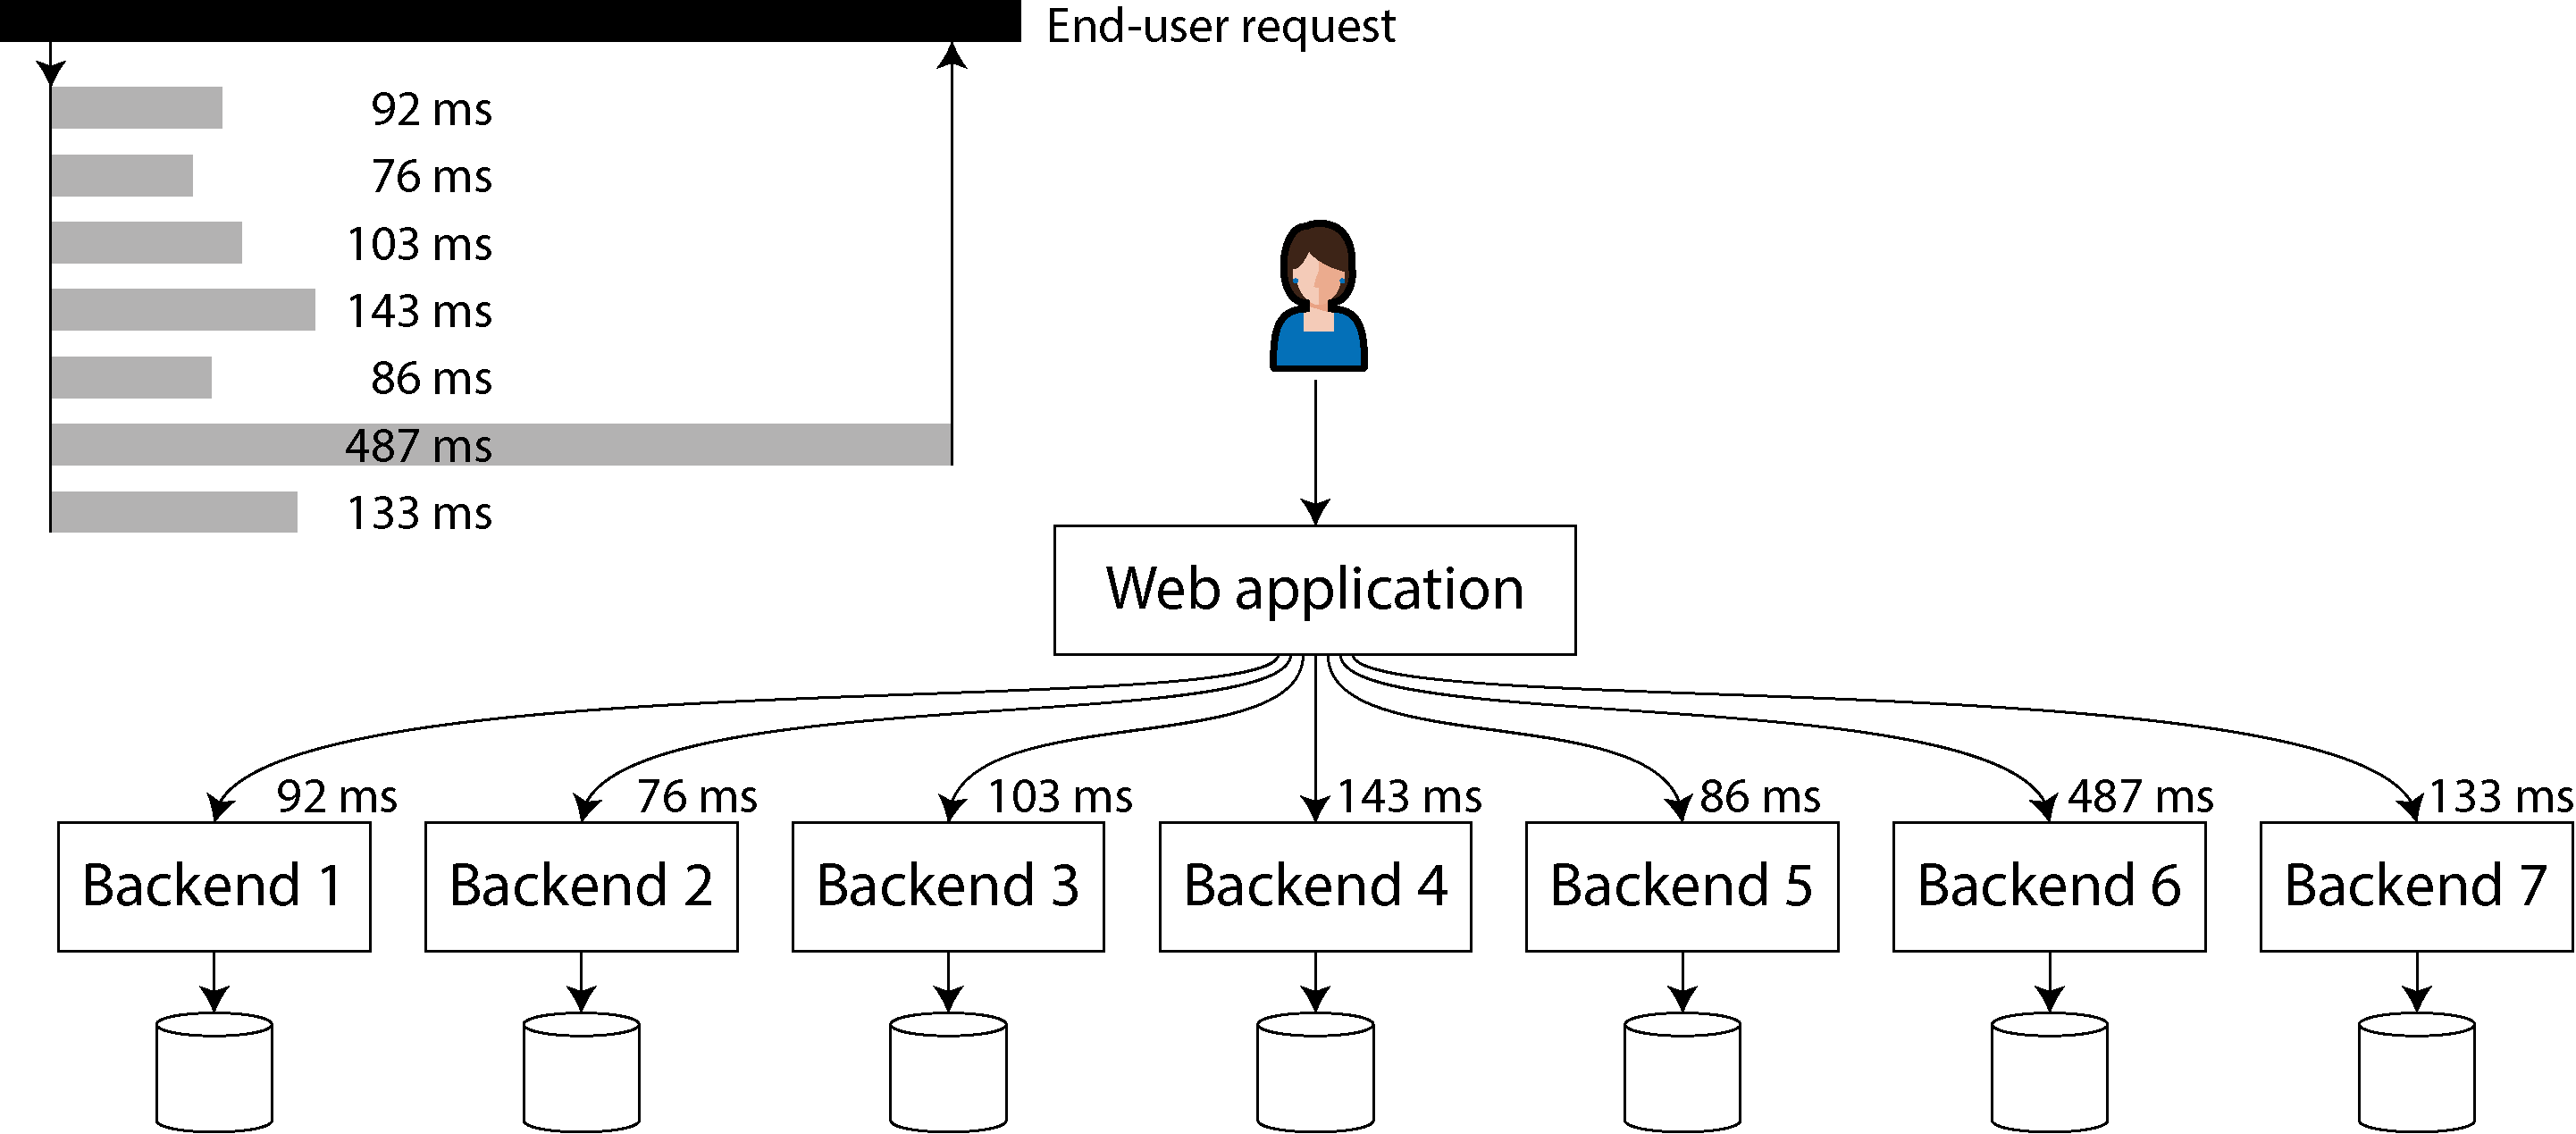
Figure 2-6. When several backend calls are needed to serve a request, just a single slow call can slow down the entire end-user request.
Percentiles are often used in service level objectives (SLOs) and service level agreements (SLAs) as ways of defining the expected performance and availability of a service [28]. For example, an SLO may set a target for a service to have a median response time of less than 200 ms and a 99th percentile under 1 second, and a target that at least 99.9% of valid requests result in non-error responses. An SLA is a contract that specifies what happens if the SLO is not met (e.g., customers may be entitled to a refund). That’s the basic idea, at least; in practice, defining good availability metrics for SLOs and SLAs is not straightforward [29, 30].
Reliability and Fault Tolerance
Everybody has an intuitive idea of what it means for something to be reliable or unreliable. For software, typical expectations include the following:
-
The application performs the function that the user expected.
-
The application can tolerate the user making mistakes or using the software in unexpected ways.
-
Its performance is good enough for the required use case, under the expected load and data volume.
-
The system prevents any unauthorized access and abuse.
If all those things together mean “working correctly,” then we can understand reliability as meaning, roughly, “continuing to work correctly, even when things go wrong.” To be more precise about things going wrong, we will distinguish between faults and failures [37, 38, 39]:
- Fault
-
A fault occurs when a particular part of a system stops working correctly—for example, if a single hard drive malfunctions, or a single machine crashes, or an external service (that the system depends on) has an outage.
- Failure
-
A failure occurs when the system as a whole stops providing the required service to the user—in other words, when it does not meet the SLO.
The distinction between faults and failures can be confusing because they are the same thing, just at different levels. For example, if a hard drive stops working, we say that the hard drive has failed; if the system consists of only that one hard drive, it has stopped providing the required service and thus has also failed. However, if the system consists of multiple hard drives, the failure of a single hard drive is only a fault from the point of view of the bigger system, and the bigger system might be able to tolerate that fault by having a copy of the data on another hard drive.
Fault Tolerance
We call a system fault-tolerant if it continues providing the required service to users in spite of certain faults occurring. If a system cannot tolerate a certain part becoming faulty, we call that part a single point of failure (SPOF), because a fault in that part escalates to cause the failure of the whole system.
For example, in the social network case study, a fault that might happen is that during the fan-out process, a machine involved in updating the materialized timelines crashes or become unavailable. To make this process fault-tolerant, we would need to ensure that another machine can take over this task without missing any posts that should have been delivered, and without duplicating any posts. (This idea is known as exactly-once semantics, and we will examine it in detail in Chapter 12.)
Fault tolerance is always limited to a certain number of certain types of faults. For example, a system might be able to tolerate a maximum of two hard drives failing at the same time, or a maximum of one out of three nodes crashing. It would not make sense to tolerate any number of faults; if all nodes crash, nothing can be done. If the entire planet Earth (and all servers on it) were swallowed by a black hole, tolerance of that fault would require web hosting in space—good luck getting that budget item approved.
Counterintuitively, in such fault-tolerant systems, it can make sense to increase the rate of faults by triggering them deliberately—for example, by randomly killing individual processes without warning. This is called fault injection. Many critical bugs are actually due to poor error handling [40]; by deliberately inducing faults, you ensure that the fault-tolerance machinery is continually exercised and tested, which can increase your confidence that faults will be handled correctly when they occur naturally. Chaos engineering is a discipline that aims to improve confidence in fault-tolerance mechanisms through experiments such as deliberately injecting faults [41].
Although we generally prefer tolerating faults over preventing faults, in some cases where prevention is better than cure (e.g., because no cure exists). This is the case with security matters, for example; if an attacker has compromised a system and gained access to sensitive data, that event cannot be undone. However, this book mostly deals with the kinds of faults that can be cured, as described in the following sections.
Hardware and Software Faults
When we think of causes of system failure, hardware faults quickly come to mind:
-
Approximately 2%–5% of magnetic hard drives fail per year [42, 43]; in a storage cluster with 10,000 disks, we should therefore expect on average one disk failure per day. Recent data suggests that disks are getting more reliable, but failure rates remain significant [44].
-
Approximately 0.5%–1% of solid state drives (SSDs) fail per year [45]. Small numbers of bit errors are corrected automatically [46], but uncorrectable errors occur approximately once per year per drive, even in drives that are fairly new (i.e., that have experienced little wear). This error rate is higher than that of magnetic hard drives [47, 48].
-
Other hardware components (such as power supplies, RAID controllers, and memory modules) also fail, although less frequently than hard drives [49, 50].
-
Approximately 1 in 1,000 machines has a CPU core that occasionally computes the wrong result, likely because of manufacturing defects [51, 52, 53]. In some cases an erroneous computation leads to a crash, but in other cases it leads to a program simply returning the wrong result.
-
Data in RAM can be corrupted, either because of random events such as cosmic rays or because of permanent physical defects. Even when memory with error-correcting codes (ECC) is used, more than 1% of machines encounter an uncorrectable error in a given year, which typically leads to a crash of the machine and the affected memory module needing to be replaced [54]. Furthermore, certain pathological memory access patterns can flip bits with high probability [55].
-
An entire datacenter might become unavailable (e.g., because of a power outage or network misconfiguration) or even be permanently destroyed (e.g., by fire, flood, or earthquake [56]). A solar storm, which induces large electrical currents in long-distance wires when the sun ejects a large mass of charged particles, could damage power grids and undersea network cables [57]. Although such large-scale failures are rare, their impact can be catastrophic if a service cannot tolerate the loss of a datacenter [58].
These events are rare enough that you often don’t need to worry about them when working on a small system, as long as you can easily replace hardware that becomes faulty. However, in a large-scale system, hardware faults happen often enough that they become part of normal system operation.
Tolerating hardware faults through redundancy
Our first response to unreliable hardware is usually to add redundancy to the individual hardware components in order to reduce the failure rate of the system. Disks may be set up in a RAID configuration (spreading data across multiple disks in the same machine so that a failed disk does not cause data loss), servers may have dual power supplies and hot-swappable CPUs, and datacenters may have batteries and diesel generators for backup power. Such redundancy can often keep a machine running uninterrupted for years.
Redundancy is most effective when component faults are independent—that is, when the occurrence of one fault does not change the likelihood that another fault will occur. However, experience has shown significant correlations between component failures [43, 59, 60]. Unavailability of an entire server rack or an entire datacenter still happens more often than we would like.
Hardware redundancy increases the uptime of a single machine; however, as discussed in “Distributed Versus Single-Node Systems”, using a distributed system has advantages, such as being able to tolerate a complete outage of one datacenter. For this reason, cloud systems tend to focus less on the reliability of individual machines and instead aim to make services highly available by tolerating faulty nodes at the software level. Cloud providers use availability zones to identify which resources are physically co-located; resources in the same place are more likely to fail at the same time than geographically separated resources.
The fault-tolerance techniques we discuss in this book are designed to tolerate the loss of entire machines, racks, or availability zones. They generally work by allowing a machine in one datacenter to take over when a machine in another datacenter fails or becomes unreachable. We will discuss such techniques for fault tolerance in Chapters 6, 10, and various other points in this book.
Systems that can tolerate the loss of entire machines also have operational advantages. A single-server system requires planned downtime if you need to reboot the machine (to apply operating system security patches, for example), whereas a multi-node fault-tolerant system can be patched by restarting one node at a time, without affecting the service for users. This is called a rolling upgrade, and we will discuss it further in Chapter 5.
Software faults
Although hardware failures can be weakly correlated, they are still mostly independent—for example, if one disk fails, other disks in the same machine will likely be fine, at least for a while. On the other hand, software faults are often very highly correlated, because it is common for many nodes to run the same software and thus have the same bugs [61, 62]. Such faults are harder to anticipate, and they tend to cause many more system failures than uncorrelated hardware faults [49]. Examples include the following:
-
A software bug that causes every node to fail at the same time in particular circumstances. For instance, on June 30, 2012, a leap second caused many Java applications to hang simultaneously because of a bug in the Linux kernel, bringing down several internet services [63]. And because of a firmware bug, all SSDs of certain models suddenly fail after precisely 32,768 hours of operation (less than four years), rendering the data on them unrecoverable [64].
-
A runaway process that uses up a shared, limited resource, such as CPU time, memory, disk space, network bandwidth, or threads [65]. For instance, a process that consumes too much memory while processing a large request may be killed by the operating system, or a bug in a client library could cause a much higher request volume than anticipated [66].
-
A service that the system depends on slows down, becomes unresponsive, or starts returning corrupted responses.
-
An interaction between different systems results in emergent behavior that does not occur when each system is tested in isolation [67].
-
Cascading failures, where a problem in one component causes another component to become overloaded and slow down, which in turn brings down another component [68, 69].
The bugs that cause these kinds of software faults often lie dormant for a long time until they are triggered by an unusual set of circumstances. In those circumstances, it is revealed that the software is making some kind of assumption about its environment—and while that assumption is usually true, it eventually stops being true for some reason [70, 71].
The problem of systematic faults in software has no quick solution. Lots of small things can help: carefully thinking about assumptions and interactions in the system; thorough testing; ensuring process isolation; allowing processes to crash and restart; avoiding feedback loops such as retry storms (see “When an Overloaded System Won’t Recover”); measuring, monitoring, and analyzing system behavior in production.
Humans and Reliability
Humans design and build software systems, and the operators who keep the systems running are also human. Unlike machines, humans don’t just follow rules; one of their strengths is being creative and adaptive in getting their jobs done. However, this characteristic also leads to unpredictability, and sometimes to mistakes that can lead to failures, despite best intentions. For example, one study of large internet services found that configuration changes by operators were the leading cause of outages, whereas hardware faults (servers or network) played a role in only 10%–25% of cases [72].
It is tempting to label such problems as “human error” and to wish that they could be solved by better controlling human behavior through tighter procedures and compliance with rules. However, blaming people for mistakes is counterproductive. What we call “human error” is not really the cause of an incident, but rather a symptom of a problem with the sociotechnical system in which people are trying their best to do their jobs [73]. Often complex systems have emergent behavior, in which unexpected interactions between components may also lead to failures [74].
Various technical measures can help minimize the impact of human mistakes, including thorough testing (both handwritten tests and property testing on lots of random inputs) [40], rollback mechanisms for quickly reverting configuration changes, gradual rollouts of new code, detailed and clear monitoring, observability tools for diagnosing production issues (see “Problems with Distributed Systems”), and well-designed interfaces that encourage “the right thing” and discourage “the wrong thing.”
However, these all require an investment of time and money, and in the pragmatic reality of everyday business, organizations often prioritize revenue-generating activities over measures that increase their systems’ resilience against mistakes. Given a choice between more features and more testing, many organizations understandably choose features. Then, when a preventable mistake inevitably occurs, blaming the person who made the mistake does not make sense; the problem is the organization’s priorities.
Increasingly, organizations are adopting a culture of blameless postmortems: after an incident, the people involved are encouraged to share full details about what happened, without fear of punishment, since this allows others in the organization to learn how to prevent similar problems in the future [75]. This process may uncover a need to change business priorities, invest in areas that have been neglected, change the incentives for the people involved, or bring another systemic issue to management’s attention.
As a general principle, when investigating an incident, you should be suspicious of simplistic answers. “Bob should have been more careful when deploying that change” is not productive, but neither is “We must rewrite the backend in Haskell.” Instead, management should take the opportunity to learn the details of how the sociotechnical system works from the point of view of the people who work with it every day, and take steps to improve it based on this feedback [73].
Scalability
Even if a system is working reliably today, that doesn’t mean it will necessarily work reliably in the future. One common reason for degradation is increased load. Perhaps the system has grown from 10,000 concurrent users to 100,000 concurrent users, or from 1 million to 10 million. Perhaps it is processing much larger volumes of data than it did before.
Scalability is the term we use to describe a system’s ability to cope with increased load. Sometimes, when discussing scalability, people make comments along the lines of, “You’re not Google or Amazon. Stop worrying about scale and just use a relational database.” Whether this maxim applies to you depends on the type of application you are building.
If you are building a new product that currently has only a small number of users, perhaps at a startup, the overriding engineering goal is usually to keep the system as simple and flexible as possible so that you can easily modify and adapt the features of your product as you learn more about customers’ needs [80]. In such an environment, it is counterproductive to worry about hypothetical scale that might be needed in the future. In the best case, investments in scalability are wasted effort and premature optimization; in the worst case, they lock you into an inflexible design and make it harder to evolve your application.
Scalability is not a one-dimensional label—it is meaningless to say “X is scalable” or “Y doesn’t scale.” Rather, discussing scalability means considering questions like these:
-
If the system grows in a particular way, what are our options for coping with the growth?
-
How can we add computing resources to handle the additional load?
-
Based on current growth projections, when will we hit the limits of our current architecture?
If you succeed in making your application popular, and therefore are handling a growing amount of load, you will learn where your performance bottlenecks lie and along which dimensions you need to scale. At that point, it’s time to start worrying about techniques for scalability.
Understanding Load
First, you need a clear understanding of the current load on the system. Only then can you discuss growth questions (“What happens if our load doubles?”). Often this will be a measure of throughput—for example, the number of requests per second to a service, the number of gigabytes of new data arriving per day, or the number of shopping cart checkouts per hour. Sometimes you care about the peak of a variable quantity, such as the number of simultaneously online users in our social network case study.
Often other statistical characteristics of the load affect the access patterns and hence the scalability requirements. For example, you may need to know the ratio of reads to writes in a database, the hit rate on a cache, or the number of data items per user (followers, in our case study). Perhaps the average case is what matters for you, or perhaps your bottleneck is dominated by a small number of extreme cases. It all depends on the details of your particular application.
Once you understand the load on your system, you can investigate what happens when the load increases. You can look at this in two ways:
-
When you increase the load in a certain way and keep the system resources (CPUs, memory, network bandwidth, etc.) unchanged, how is the performance of your system affected?
-
When you increase the load in a certain way, how much do you need to increase the resources if you want to keep performance unchanged?
Usually the goal is to keep the performance of the system within the requirements of the SLA (see “Use of Response Time Metrics”) while also minimizing the cost of running the system. The greater the required computing resources, the higher the cost. Some types of hardware might be more cost-effective than others, and these factors may change over time as new types of hardware become available.
If doubling the resources will enable you to handle twice the load while keeping performance the same, we say that you have linear scalability, and this is considered a good thing. Occasionally it is possible to handle twice the load with less than double the resources, because of economies of scale or a better distribution of peak load [81, 82]. Much more likely is that the cost grows faster than linearly. There may be many reasons for the inefficiency; for example, if you have a lot of data, processing a single write request may involve more work than if you have a small amount of data, even if the size of the request is the same.
Principles for Scalability
The architecture of systems that operate at large scale is usually highly specific to the application. There is no such thing as a generic, one-size-fits-all scalable architecture (informally known as magic scaling sauce). For example, a system designed to handle 100,000 requests per second, each 1 kB in size, looks very different from a system designed for 3 requests per minute, each 2 GB in size—even though the two systems have the same data throughput (100 MB/second).
Moreover, an architecture that is appropriate for one level of load is unlikely to cope with 10 times that load. If you are working on a fast-growing service, it is therefore probable that you will need to rethink your architecture on every order of magnitude load increase. As the needs of the application are likely to evolve, it is usually not worth planning future scaling needs more than one order of magnitude in advance.
A good general principle for scalability is to break a system into smaller components that can operate largely independently from one another. This is the underlying principle behind microservices (see “Microservices and Serverless”), sharding (Chapter 7), stream processing (Chapter 12), and shared-nothing architectures. The challenge lies in knowing where to draw the line between things that should be together and things that should be apart. Design guidelines for microservices can be found in other books [86], and we discuss sharding of shared-nothing systems in Chapter 7.
Another good principle is not to make things more complicated than necessary. If a single-machine database will do the job, it’s probably preferable to a complicated distributed setup. Autoscaling systems (which automatically add or remove resources in response to demand) are cool, but if your load is fairly predictable, a manually scaled system may have fewer operational surprises (see “Operations: Automatic Versus Manual Rebalancing”). A system with 5 services is simpler than one with 50. Good architectures usually involve a pragmatic mixture of approaches.
Maintainability
Software does not wear out or suffer material fatigue, so it does not break in the same ways as mechanical objects do. But the requirements for an application frequently evolve, the environment that the software runs in changes (such as its dependencies and the underlying platform), and it may have bugs that need fixing.
It is widely recognized that the majority of the cost of software is not in its initial development but in its ongoing maintenance—fixing bugs, keeping its systems operational, investigating failures, adapting it to new platforms, modifying it for new use cases, repaying technical debt, and adding new features [87, 88].
Maintenance can be complex, especially for legacy systems. A system that has been successfully running for a long time may well use outdated technologies that not many engineers understand today (such as mainframes and COBOL code), and institutional knowledge of how and why the system was designed in a certain way may have been lost as people have left the organization. Fixing other people’s mistakes might also be necessary. Because computer systems are often intertwined with the human organizations they support, maintenance of such systems is as much a people problem as a technical one [89].
Every system we create today will one day become a legacy system if it is valuable enough to survive for a long time. To minimize the pain for future generations who need to maintain our software, we should design it with maintenance in mind. Although we cannot always predict which decisions might create maintenance headaches in the future, in this book we will pay attention to several principles that are widely applicable:
- Operability
-
Make it easy for the organization to keep the system running smoothly.
- Simplicity
-
Make it easy for new engineers to understand the system, by implementing it using well-understood, consistent patterns and structures and avoiding unnecessary complexity.
- Evolvability
-
Make it easy for engineers to make changes to the system in the future, adapting it and extending it for unanticipated use cases as requirements change.
Operability: Making Life Easy for Operations
We previously discussed the role of operations in “Operations in the Cloud Era”, and we saw that human processes are at least as important for reliable operations as software tools. In fact, it has been suggested that “good operations can often work around the limitations of bad (or incomplete) software, but good software cannot run reliably with bad operations” [62].
In large-scale systems consisting of many thousands of machines, manual maintenance would be unreasonably expensive, and automation is essential. However, automation can be a two-edged sword. There will always be edge cases (such as rare failure scenarios) that require manual intervention from the operations team, and since the cases that cannot be handled automatically tend to be the most complex, greater automation requires a more skilled operations team that can resolve those issues [90].
Additionally, an automated system that goes wrong is often harder to troubleshoot than a system that relies on an operator to perform some actions manually. For that reason, more automation is not always better for operability. However, some amount of automation is important—the sweet spot will depend on the specifics of your particular application and organization.
Good operability means making routine tasks easy, allowing the operations team to focus on high-value activities. Data systems can help by doing the following [91]:
-
Allowing monitoring tools to check the system’s key metrics and supporting observability tools (see “Problems with Distributed Systems”) to give insights into the system’s runtime behavior. A variety of commercial and open source tools can help here [92].
-
Avoiding dependency on individual machines (allowing machines to be taken down for maintenance while the system as a whole continues running uninterrupted).
-
Providing good documentation and an easy-to-understand operational model (“If I do X, Y will happen”).
-
Providing good default behavior, but also giving administrators the freedom to override defaults when needed.
-
Self-healing where appropriate, but also giving administrators manual control over the system state when needed.
-
Exhibiting predictable behavior, minimizing surprises.
Simplicity: Managing Complexity
Small software projects can have delightfully simple and expressive code, but as projects get larger, they often become very complex and difficult to understand. This complexity slows down everyone who needs to work on the system, further increasing the cost of maintenance. A software project mired in complexity is sometimes described as a big ball of mud [93].
When complexity makes maintenance hard, budgets and schedules are often overrun. In complex software, there is also a greater risk of introducing bugs when making a change. When the system is harder for developers to understand and reason about, hidden assumptions, unintended consequences, and unexpected interactions are more easily overlooked [71]. Conversely, reducing complexity greatly improves the maintainability of software, and thus simplicity should be a key goal for the systems we build.
Simple systems are easier to understand, so we should try to solve a given problem in the simplest way possible. Unfortunately, this is easier said than done. Whether something is simple is often a subjective matter, as there is no objective standard of simplicity [94]. For example, one system may hide a complex implementation behind a simple interface, whereas another may have a simple implementation that exposes more internal detail to its users—which one is simpler?
One attempt at reasoning about complexity breaks it into two categories: essential and accidental [95]. The idea is that essential complexity is inherent in the problem domain of the application, while accidental complexity arises only because of limitations of our tooling. Unfortunately, this distinction is also flawed, because boundaries between the essential and the accidental shift as our tooling evolves [96].
One of the best tools we have for managing complexity is abstraction. A good abstraction can hide a great deal of implementation detail behind a clean, simple-to-understand façade. A good abstraction can also be used for a wide range of applications. Not only is this reuse more efficient than reimplementing a similar thing multiple times, but it also leads to higher-quality software, as quality improvements in the abstracted component benefit all applications that use it.
For example, high-level programming languages are abstractions that hide machine code, CPU registers, and system calls. SQL is an abstraction that hides complex on-disk and in-memory data structures, concurrent requests from other clients, and inconsistencies after crashes. Of course, when programming in a high-level language, we are still using machine code; we are just not using it directly, because the programming language abstraction saves us from having to think about it.
Abstractions for application code that aim to reduce its complexity can be created using methodologies such as design patterns [97] and domain-driven design (DDD) [98]. This book is not about such application-specific abstractions, but rather about general-purpose abstractions on top of which you can build your applications, such as database transactions, indexes, and event logs. If you want to use techniques such as DDD, you can implement them on top of the foundations described in this book.
Evolvability: Making Change Easy
It’s extremely unlikely that your system’s requirements will remain unchanged forever. They are much more likely to be in constant flux: you learn new facts, previously unanticipated use cases emerge, business priorities change, users request new features, new platforms replace old platforms, legal or regulatory requirements change, growth of the system forces architectural changes, etc.
In terms of organizational processes, Agile working patterns provide a framework for adapting to change. The Agile community has also developed technical tools and processes that are helpful when building software in a frequently changing environment, such as test-driven development (TDD) and refactoring. In this book, we search for ways of increasing agility at the level of a system consisting of several applications or services with different characteristics.
The ease with which you can modify a data system and adapt it to changing requirements is closely linked to its simplicity and its abstractions. Loosely coupled, simple systems are usually easier to modify than tightly coupled, complex ones. Since this is such an important idea, we will use a different word to refer to agility on a data system level: evolvability [99].
One major factor that makes change difficult in large systems is irreversibility [100]. For example, say you are migrating from one database to another. If you cannot switch back to the old system in case of problems with the new one, the stakes are much higher than if you can easily go back. Therefore, irreversible actions need to be taken very carefully. Minimizing irreversibility improves flexibility.
Summary
In this chapter we examined several examples of nonfunctional requirements: performance, reliability, scalability, and maintainability. Through these topics, we also encountered principles and terminology that will be relevant throughout the rest of the book.
We started with a case study of implementing home timelines in a social network, which illustrated some of the challenges that arise at scale. We then discussed how to measure performance (e.g., using response time percentiles) and the load on a system (e.g., using throughput metrics), and how these metrics are used in SLAs. Scalability is a closely related concept: it focuses on ensuring that performance stays the same when the load grows. We saw some general principles for scalability, such as breaking a task into smaller parts that can operate independently, and we will dive into greater technical detail on scalability techniques in the following chapters.
To achieve reliability, you can use fault-tolerance techniques, which allow a system to continue providing its services even if a component (e.g., a disk, a machine, or another service) is faulty. We saw examples of hardware faults that can occur and distinguished them from software faults, which can be harder to deal with because they are often strongly correlated. Another aspect of achieving reliability is to build resilience against humans making mistakes, and we saw blameless postmortems as a technique for learning from incidents.
Finally, we examined several facets of maintainability, including supporting the work of operations teams, managing complexity, and making it easy to evolve an application’s functionality over time. There are no easy answers to how to achieve these goals, but one approach that can help is to build applications using well-understood building blocks that provide useful abstractions. The rest of this book will cover a selection of building blocks that have proved to be valuable in practice.
Footnotes
References
[1] Mike Cvet. “How We Learned to Stop Worrying and Love Fan-in at Twitter.” At QCon San Francisco, December 2016.
[2] Raffi Krikorian. “Timelines at Scale.” At QCon San Francisco, November 2012. Archived at perma.cc/V9G5-KLYK
[3] Twitter. “Twitter’s Recommendation Algorithm.” blog.x.com, March 2023. Archived at perma.cc/L5GT-229T
[4] Raffi Krikorian. “New Tweets per Second Record, and How!” blog.x.com, August 2013. Archived at perma.cc/6JZN-XJYN
[5] Jaz Volpert. “When Imperfect Systems Are Good, Actually: Bluesky’s Lossy Timelines.” jazco.dev, February 2025. Archived at perma.cc/2PVE-L2MX
[6] Samuel Axon. “3% of Twitter’s Servers Dedicated to Justin Bieber.” mashable.com, September 2010. Archived at perma.cc/F35N-CGVX
[7] Nathan Bronson, Abutalib Aghayev, Aleksey Charapko, and Timothy Zhu. “Metastable Failures in Distributed Systems.” At Workshop on Hot Topics in Operating Systems (HotOS), May 2021. doi:10.1145/3458336.3465286
[8] Marc Brooker. “Metastability and Distributed Systems.” brooker.co.za, May 2021. Archived at perma.cc/7FGJ-7XRK
[9] Lexiang Huang, Matthew Magnusson, Abishek Bangalore Muralikrishna, Salman Estyak, Rebecca Isaacs, Abutalib Aghayev, Timothy Zhu, and Aleksey Charapko. “Metastable Failures in the Wild.” At 16th USENIX Symposium on Operating Systems Design and Implementation (OSDI), July 2022.
[10] Marc Brooker. “Exponential Backoff and Jitter.” aws.amazon.com, March 2015. Archived at perma.cc/R6MS-AZKH
[11] Marc Brooker. “What Is Backoff For?” brooker.co.za, August 2022. Archived at perma.cc/PW9N-55Q5
[12] Michael T. Nygard. Release It!, 2nd edition. Pragmatic Bookshelf, 2018. ISBN: 9781680502398
[13] Frank Chen. “Slowing Down to Speed Up—Circuit Breakers for Slack’s CI/CD.” slack.engineering, August 2022. Archived at perma.cc/5FGS-ZPH3
[14] Marc Brooker. “Fixing Retries with Token Buckets and Circuit Breakers.” brooker.co.za, February 2022. Archived at perma.cc/MD6N-GW26
[15] David Yanacek. “Using Load Shedding to Avoid Overload.” Amazon Builders’ Library, aws.amazon.com. Archived at perma.cc/9SAW-68MP
[16] Matthew Sackman. “Pushing Back.” wellquite.org, May 2016. Archived at perma.cc/3KCZ-RUFY
[17] Dmitry Kopytkov and Patrick Lee. “Meet Bandaid, the Dropbox Service Proxy.” dropbox.tech, March 2018. Archived at perma.cc/KUU6-YG4S
[18] Haryadi S. Gunawi, Riza O. Suminto, Russell Sears, Casey Golliher, Swaminathan Sundararaman, Xing Lin, Tim Emami, Weiguang Sheng, Nematollah Bidokhti, Caitie McCaffrey, Gary Grider, Parks M. Fields, Kevin Harms, Robert B. Ross, Andree Jacobson, Robert Ricci, Kirk Webb, Peter Alvaro, H. Birali Runesha, Mingzhe Hao, and Huaicheng Li. “Fail-Slow at Scale: Evidence of Hardware Performance Faults in Large Production Systems.” At 16th USENIX Conference on File and Storage Technologies, February 2018.
[19] Marc Brooker. “Is the Mean Really Useless?” brooker.co.za, December 2017. Archived at perma.cc/U5AE-CVEM
[20] Giuseppe DeCandia, Deniz Hastorun, Madan Jampani, Gunavardhan Kakulapati, Avinash Lakshman, Alex Pilchin, Swaminathan Sivasubramanian, Peter Vosshall, and Werner Vogels. “Dynamo: Amazon’s Highly Available Key-Value Store.” At 21st ACM Symposium on Operating Systems Principles (SOSP), October 2007. doi:10.1145/1294261.1294281
[21] Kathryn Whitenton. “The Need for Speed, 23 Years Later.” nngroup.com, May 2020. Archived at perma.cc/C4ER-LZYA
[22] Greg Linden. “Marissa Mayer at Web 2.0.” glinden.blogspot.com, November 2005. Archived at perma.cc/V7EA-3VXB
[23] Jake Brutlag. “Speed Matters for Google Web Search.” services.google.com, June 2009. Archived at perma.cc/BK7R-X7M2
[24] Eric Schurman and Jake Brutlag. “Performance Related Changes and Their User Impact.” Talk at Velocity 2009.
[25] Akamai Technologies, Inc. “The State of Online Retail Performance.” akamai.com, April 2017. Archived at perma.cc/UEK2-HYCS
[26] Xiao Bai, Ioannis Arapakis, B. Barla Cambazoglu, and Ana Freire. “Understanding and Leveraging the Impact of Response Latency on User Behaviour in Web Search.” ACM Transactions on Information Systems, volume 36, issue 2, article 21, April 2018. doi:10.1145/3106372
[27] Jeffrey Dean and Luiz André Barroso. “The Tail at Scale.” Communications of the ACM, volume 56, issue 2, pages 74–80, February 2013. doi:10.1145/2408776.2408794
[28] Alex Hidalgo. Implementing Service Level Objectives: A Practical Guide to SLIs, SLOs, and Error Budgets. O’Reilly Media, 2020. ISBN: 9781492076813
[29] Jeffrey C. Mogul and John Wilkes. “Nines Are Not Enough: Meaningful Metrics for Clouds.” At 17th Workshop on Hot Topics in Operating Systems (HotOS), May 2019. doi:10.1145/3317550.3321432
[30] Tamás Hauer, Philipp Hoffmann, John Lunney, Dan Ardelean, and Amer Diwan. “Meaningful Availability.” At 17th USENIX Symposium on Networked Systems Design and Implementation (NSDI), February 2020.
[31] Gil Tene. “HdrHistogram: A High Dynamic Range Histogram.” hdrhistogram.github.io/HdrHistogram
[32] Ted Dunning. “The t-digest: Efficient Estimates of Distributions.” Software Impacts, volume 7, article 100049, February 2021. doi:10.1016/j.simpa.2020.100049
[33] David Kohn. “How Percentile Approximation Works (and Why It’s More Useful than Averages).” timescale.com, September 2021. Archived at perma.cc/3PDP-NR8B
[34] Heinrich Hartmann and Theo Schlossnagle. “Circllhist—A Log-Linear Histogram Data Structure for IT Infrastructure Monitoring.” arXiv:2001.06561, January 2020.
[35] Charles Masson, Jee E. Rim, and Homin K. Lee. “DDSketch: A Fast and Fully-Mergeable Quantile Sketch with Relative-Error Guarantees.” Proceedings of the VLDB Endowment, volume 12, issue 12, pages 2195–2205, August 2019. doi:10.14778/3352063.3352135
[36] Baron Schwartz. “Why Percentiles Don’t Work the Way You Think.” solarwinds.com, November 2016. Archived at perma.cc/469T-6UGB
[37] Walter L. Heimerdinger and Charles B. Weinstock. “A Conceptual Framework for System Fault Tolerance.” Technical Report CMU/SEI-92-TR-033, Software Engineering Institute, Carnegie Mellon University, October 1992. Archived at perma.cc/GD2V-DMJW
[38] Felix C. Gärtner. “Fundamentals of Fault-Tolerant Distributed Computing in Asynchronous Environments.” ACM Computing Surveys, volume 31, issue 1, pages 1–26, March 1999. doi:10.1145/311531.311532
[39] Algirdas Avižienis, Jean-Claude Laprie, Brian Randell, and Carl Landwehr. “Basic Concepts and Taxonomy of Dependable and Secure Computing.” IEEE Transactions on Dependable and Secure Computing, volume 1, issue 1, pages 11–33, January 2004. doi:10.1109/TDSC.2004.2
[40] Ding Yuan, Yu Luo, Xin Zhuang, Guilherme Renna Rodrigues, Xu Zhao, Yongle Zhang, Pranay U. Jain, and Michael Stumm. “Simple Testing Can Prevent Most Critical Failures: An Analysis of Production Failures in Distributed Data-Intensive Systems.” At 11th USENIX Symposium on Operating Systems Design and Implementation (OSDI), October 2014.
[41] Casey Rosenthal and Nora Jones. Chaos Engineering. O’Reilly Media, 2020. ISBN: 9781492043867
[42] Eduardo Pinheiro, Wolf-Dietrich Weber, and Luiz Andre Barroso. “Failure Trends in a Large Disk Drive Population.” At 5th USENIX Conference on File and Storage Technologies (FAST), February 2007.
[43] Bianca Schroeder and Garth A. Gibson. “Disk Failures in the Real World: What Does an Mttf of 1,000,000 Hours Mean to You?” At 5th USENIX Conference on File and Storage Technologies (FAST), February 2007.
[44] Andy Klein. “Backblaze Drive Stats for Q2 2021.” backblaze.com, August 2021. Archived at perma.cc/2943-UD5E
[45] Iyswarya Narayanan, Di Wang, Myeongjae Jeon, Bikash Sharma, Laura Caulfield, Anand Sivasubramaniam, Ben Cutler, Jie Liu, Badriddine Khessib, and Kushagra Vaid. “SSD Failures in Datacenters: What? When? And Why?” At 9th ACM International on Systems and Storage Conference (SYSTOR), June 2016. doi:10.1145/2928275.2928278
[46] Alibaba Cloud Storage Team. “Storage System Design Analysis: Factors Affecting NVMe SSD Performance (1).” alibabacloud.com, January 2019. Archived at archive.org
[47] Bianca Schroeder, Raghav Lagisetty, and Arif Merchant. “Flash Reliability in Production: The Expected and the Unexpected.” At 14th USENIX Conference on File and Storage Technologies (FAST), February 2016.
[48] Jacob Alter, Ji Xue, Alma Dimnaku, and Evgenia Smirni. “SSD Failures in the Field: Symptoms, Causes, and Prediction Models.” At International Conference for High Performance Computing, Networking, Storage and Analysis (SC), November 2019. doi:10.1145/3295500.3356172
[49] Daniel Ford, François Labelle, Florentina I. Popovici, Murray Stokely, Van-Anh Truong, Luiz Barroso, Carrie Grimes, and Sean Quinlan. “Availability in Globally Distributed Storage Systems.” At 9th USENIX Symposium on Operating Systems Design and Implementation (OSDI), October 2010.
[50] Kashi Venkatesh Vishwanath and Nachiappan Nagappan. “Characterizing Cloud Computing Hardware Reliability.” At 1st ACM Symposium on Cloud Computing (SoCC), June 2010. doi:10.1145/1807128.1807161
[51] Peter H. Hochschild, Paul Turner, Jeffrey C. Mogul, Rama Govindaraju, Parthasarathy Ranganathan, David E. Culler, and Amin Vahdat. “Cores That Don’t Count.” At Workshop on Hot Topics in Operating Systems (HotOS), June 2021. doi:10.1145/3458336.3465297
[52] Harish Dattatraya Dixit, Sneha Pendharkar, Matt Beadon, Chris Mason, Tejasvi Chakravarthy, Bharath Muthiah, and Sriram Sankar. Silent Data Corruptions at Scale. arXiv:2102.11245, February 2021.
[53] Diogo Behrens, Marco Serafini, Sergei Arnautov, Flavio P. Junqueira, and Christof Fetzer. “Scalable Error Isolation for Distributed Systems.” At 12th USENIX Symposium on Networked Systems Design and Implementation (NSDI), May 2015.
[54] Bianca Schroeder, Eduardo Pinheiro, and Wolf-Dietrich Weber. “DRAM Errors in the Wild: A Large-Scale Field Study.” At 11th International Joint Conference on Measurement and Modeling of Computer Systems (SIGMETRICS), June 2009. doi:10.1145/1555349.1555372
[55] Yoongu Kim, Ross Daly, Jeremie Kim, Chris Fallin, Ji Hye Lee, Donghyuk Lee, Chris Wilkerson, Konrad Lai, and Onur Mutlu. “Flipping Bits in Memory Without Accessing Them: An Experimental Study of DRAM Disturbance Errors.” At 41st Annual International Symposium on Computer Architecture (ISCA), June 2014. doi:10.5555/2665671.2665726
[56] Tim Bray. “Worst Case.” tbray.org, October 2021. Archived at perma.cc/4QQM-RTHN
[57] Sangeetha Abdu Jyothi. “Solar Superstorms: Planning for an Internet Apocalypse.” At ACM SIGCOMM Conference, August 2021. doi:10.1145/3452296.3472916
[58] Adrian Cockcroft. “Failure Modes and Continuous Resilience.” adrianco.medium.com, November 2019. Archived at perma.cc/7SYS-BVJP
[59] Shujie Han, Patrick P. C. Lee, Fan Xu, Yi Liu, Cheng He, and Jiongzhou Liu. “An In-Depth Study of Correlated Failures in Production SSD-Based Data Centers.” At 19th USENIX Conference on File and Storage Technologies (FAST), February 2021.
[60] Edmund B. Nightingale, John R. Douceur, and Vince Orgovan. “Cycles, Cells and Platters: An Empirical Analysis of Hardware Failures on a Million Consumer PCs.” At 6th European Conference on Computer Systems (EuroSys), April 2011. doi:10.1145/1966445.1966477
[61] Haryadi S. Gunawi, Mingzhe Hao, Tanakorn Leesatapornwongsa, Tiratat Patana-anake, Thanh Do, Jeffry Adityatama, Kurnia J. Eliazar, Agung Laksono, Jeffrey F. Lukman, Vincentius Martin, and Anang D. Satria. “What Bugs Live in the Cloud? A Study of 3000+ Issues in Cloud Systems.” At 5th ACM Symposium on Cloud Computing (SoCC), November 2014. doi:10.1145/2670979.2670986
[62] Jay Kreps. “Getting Real About Distributed System Reliability.” blog.empathybox.com, March 2012. Archived at perma.cc/9B5Q-AEBW
[63] Nelson Minar. “Leap Second Crashes Half the Internet.” somebits.com, July 2012. Archived at perma.cc/2WB8-D6EU
[64] Hewlett Packard Enterprise. “Support Alerts—Customer Bulletin a00092491en_us.” support.hpe.com, November 2019. Archived at perma.cc/S5F6-7ZAC
[65] Lorin Hochstein. “Awesome Limits.” github.com, November 2020. Archived at perma.cc/3R5M-E5Q4
[66] Caitie McCaffrey. “Clients Are Jerks: AKA How Halo 4 DoSed the Services at Launch & How We Survived.” caitiem.com, June 2015. Archived at perma.cc/MXX4-W373
[67] Lilia Tang, Chaitanya Bhandari, Yongle Zhang, Anna Karanika, Shuyang Ji, Indranil Gupta, and Tianyin Xu. “Fail Through the Cracks: Cross-System Interaction Failures in Modern Cloud Systems.” At 18th European Conference on Computer Systems (EuroSys), May 2023. doi:10.1145/3552326.3587448
[68] Mike Ulrich. Addressing Cascading Failures. In Betsy Beyer, Jennifer Petoff, Chris Jones, and Niall Richard Murphy (ed). Site Reliability Engineering: How Google Runs Production Systems. O’Reilly Media, 2016. ISBN: 9781491929124
[69] Harri Faßbender. “Cascading Failures in Large-Scale Distributed Systems.” blog.mi.hdm-stuttgart.de, March 2022. Archived at perma.cc/K7VY-YJRX
[70] Richard I. Cook. “How Complex Systems Fail.” Cognitive Technologies Laboratory, April 2000. Archived at perma.cc/RDS6-2YVA
[71] David D. Woods. “STELLA: Report from the SNAFUcatchers Workshop on Coping with Complexity.” snafucatchers.github.io, March 2017. Archived at archive.org
[72] David Oppenheimer, Archana Ganapathi, and David A. Patterson. “Why Do Internet Services Fail, and What Can Be Done About It?” At 4th USENIX Symposium on Internet Technologies and Systems (USITS), March 2003.
[73] Sidney Dekker. The Field Guide to Understanding “Human Error”, 3rd edition. CRC Press, 2017. ISBN: 9781472439055
[74] Sidney Dekker. Drift into Failure: From Hunting Broken Components to Understanding Complex Systems. CRC Press, 2011. ISBN: 9781315257396
[75] John Allspaw. “Blameless PostMortems and a Just Culture.” etsy.com, May 2012. Archived at perma.cc/YMJ7-NTAP
[76] Itzy Sabo. “Uptime Guarantees—A Pragmatic Perspective.” world.hey.com, March 2023. Archived at perma.cc/F7TU-78JB
[77] Michael Jurewitz. “The Human Impact of Bugs.” jury.me, March 2013. Archived at perma.cc/5KQ4-VDYL
[78] Mark Halper. “How Software Bugs Led to ‘One of the Greatest Miscarriages of Justice’ in British History.” Communications of the ACM, volume 68, issue 3, pages 12–14, January 2025. doi:10.1145/3703779
[79] Nicholas Bohm, James Christie, Peter Bernard Ladkin, Bev Littlewood, Paul Marshall, Stephen Mason, Martin Newby, Steven J. Murdoch, Harold Thimbleby, and Martyn Thomas. “The Legal Rule That Computers Are Presumed to be Operating Correctly—Unforeseen and Unjust Consequences.” Briefing note, benthamsgaze.org, June 2022. Archived at perma.cc/WQ6X-TMW4
[80] Dan McKinley. “Choose Boring Technology.” mcfunley.com, March 2015. Archived at perma.cc/7QW7-J4YP
[81] Andy Warfield. “Building and Operating a Pretty Big Storage System Called S3.” allthingsdistributed.com, July 2023. Archived at perma.cc/7LPK-TP7V
[82] Marc Brooker. “Surprising Scalability of Multitenancy.” brooker.co.za, March 2023. Archived at perma.cc/ZZD9-VV8T
[83] Ben Stopford. “Shared Nothing vs. Shared Disk Architectures: An Independent View.” benstopford.com, November 2009. Archived at perma.cc/7BXH-EDUR
[84] Michael Stonebraker. “The Case for Shared Nothing.” IEEE Database Engineering Bulletin, volume 9, issue 1, pages 4–9, March 1986. perma.cc/P9YL-C4PS
[85] Panagiotis Antonopoulos, Alex Budovski, Cristian Diaconu, Alejandro Hernandez Saenz, Jack Hu, Hanuma Kodavalla, Donald Kossmann, Sandeep Lingam, Umar Farooq Minhas, Naveen Prakash, Vijendra Purohit, Hugh Qu, Chaitanya Sreenivas Ravella, Krystyna Reisteter, Sheetal Shrotri, Dixin Tang, and Vikram Wakade. “Socrates: The New SQL Server in the Cloud.” At ACM International Conference on Management of Data (SIGMOD), June 2019. doi:10.1145/3299869.3314047
[86] Sam Newman. Building Microservices, 2nd edition. O’Reilly Media, 2021. ISBN: 9781492034025
[87] Nathan Ensmenger. “When Good Software Goes Bad: The Surprising Durability of an Ephemeral Technology.” At The Maintainers Conference, April 2016. Archived at perma.cc/ZXT4-HGZB
[88] Robert L. Glass. Facts and Fallacies of Software Engineering. Addison-Wesley Professional, 2002. ISBN: 9780321117427
[89] Marianne Bellotti. Kill It with Fire. No Starch Press, 2021. ISBN: 9781718501188
[90] Lisanne Bainbridge. “Ironies of Automation.” Automatica, volume 19, issue 6, pages 775–779, November 1983. doi:10.1016/0005-1098(83)90046-8
[91] James Hamilton. “On Designing and Deploying Internet-Scale Services.” At 21st Large Installation System Administration Conference (LISA), November 2007.
[92] Dotan Horovits. “Open Source for Better Observability.” horovits.medium.com, October 2021. Archived at perma.cc/R2HD-U2ZT
[93] Brian Foote and Joseph Yoder. “Big Ball of Mud.” At 4th Conference on Pattern Languages of Programs (PLoP), September 1997. Archived at perma.cc/4GUP-2PBV
[94] Marc Brooker. “What Is a Simple System?” brooker.co.za, May 2022. Archived at perma.cc/U72T-BFVE
[95] Frederick P. Brooks. “No Silver Bullet—Essence and Accident in Software Engineering.” In The Mythical Man-Month, Anniversary edition, Addison-Wesley, 1995. ISBN: 9780201835953
[96] Dan Luu. “Against Essential and Accidental Complexity.” danluu.com, December 2020. Archived at perma.cc/H5ES-69KC
[97] Erich Gamma, Richard Helm, Ralph Johnson, and John Vlissides. Design Patterns: Elements of Reusable Object-Oriented Software. Addison-Wesley Professional, 1994. ISBN: 9780201633610
[98] Eric Evans. Domain-Driven Design: Tackling Complexity in the Heart of Software. Addison-Wesley Professional, 2003. ISBN: 9780321125217
[99] Hongyu Pei Breivold, Ivica Crnkovic, and Peter J. Eriksson. “Analyzing Software Evolvability.” At 32nd Annual IEEE International Computer Software and Applications Conference (COMPSAC), July 2008. doi:10.1109/COMPSAC.2008.50
[100] Enrico Zaninotto. “From X Programming to the X Organisation.” At XP Conference, May 2002. Archived at perma.cc/R9AR-QCKZ

